
Read the official signal
Each built-in integration uses a provider’s official machine-readable status source, never scraped page markup.
Status page monitor for on-call
Watch the official machine-readable status feeds of 100+ products, filter provider incidents by the regions and components you use, and keep triage context beside your work.
Free requires no VendorStatus account. Pro checkout and renewal are handled by Polar; activation uses a Polar-issued license key.
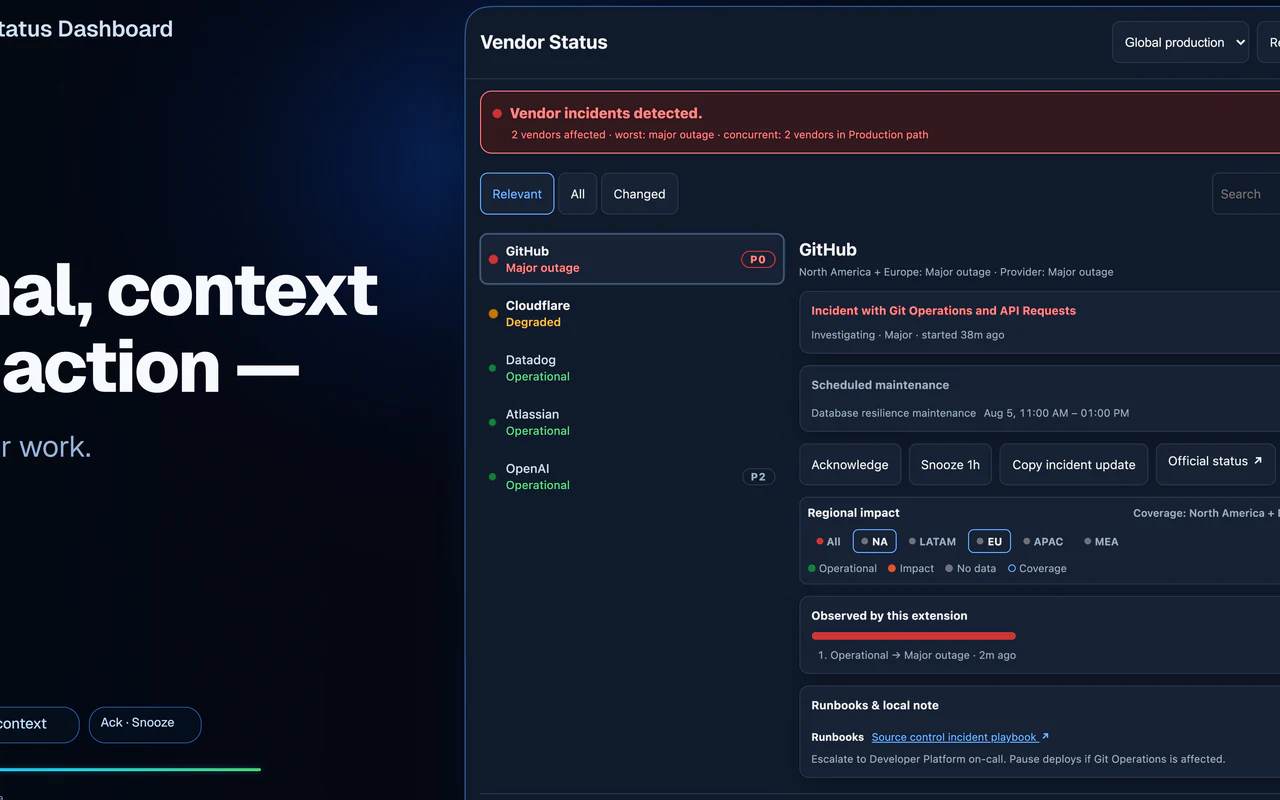
What a useful monitor should do
Each built-in integration uses a provider’s official machine-readable status source, never scraped page markup.
Keep the provider’s incident visible, then filter your operational view by relevant region, component and profile.
Mark dependencies P0, P1 or P2 so the same provider event carries the right urgency for your team.
Every signal keeps a route to the official source so responders can verify wording, timestamps and provider updates.
Profiles, criticality, notes and bounded HTTPS runbook links stay in local browser storage.
Concurrent changes are labeled as concurrent. The monitor leaves causal investigation to your own evidence.
Incident triage workflow
Read the current incident or maintenance signal from the provider’s official feed.
Check whether the affected region or component overlaps the operational profile you are using.
Use dependency criticality to distinguish a P0 production path from a lower-impact service.
Open the official proof, capture local triage context and follow the runbook your team already trusts.
The source remains authoritative
A provider may publish after users begin seeing impact. Absence of an official incident is not proof that your systems are healthy.
Official updates can be broad or incomplete. Your metrics, logs and traces remain essential for confirming user-facing impact.
The extension shows whether a vendor is reporting trouble. Your own metrics, logs and traces remain essential for causal investigation.
Straight answers
Vendor Status Dashboard reads official machine-readable status feeds from supported providers. It does not scrape status-page HTML.
Not necessarily. Provider status is global truth. Add regional and component scope plus P0, P1 or P2 criticality so your operational view reflects the dependencies you actually use.
No. It reports official provider signals and can group concurrent changes, but the provider source remains authoritative.
No. The free extension supports five enabled vendors, stores configuration locally and sends no extension telemetry to VendorStatus. See the privacy policy for the complete data boundary.
Start with your production path
Install free, enable the providers behind your critical path, then open the Side Panel when an incident starts.
No account required — and Free is free forever.